Reports and publications
On this page:
Journal articles and reports
Published journal article:
Mason K, Lindberg K, Haenfling C, Schori A, Marsters H, Read D, Borman B. Social Vulnerability Indicators for Flooding in Aotearoa New Zealand. International Journal of Environmental Research and Public Health. 2021; 18(8):3952. https://doi.org/10.3390/ijerph18083952
We published the report 'Social vulnerability to the impacts of climate-related hazards in Aotearoa New Zealand' in August 2024. This report presents results for individual social vulnerability indicators for New Zealand, including changes over time, maps by territorial authority, and differences by key population groups where possible. The social vulnerability indicators mostly draw on 2013 and 2018 Census data.
- ![]() Social vulnerability to the impacts of climate-related hazards in Aotearoa New Zealand (pdf, 9.54 MB) (Aug 2024)
Social vulnerability to the impacts of climate-related hazards in Aotearoa New Zealand (pdf, 9.54 MB) (Aug 2024)
- ![]() Appendix: Heatmap of social vulnerability indicator data (at the territorial authority level) (pdf, 397 KB) (Aug 2024)
Appendix: Heatmap of social vulnerability indicator data (at the territorial authority level) (pdf, 397 KB) (Aug 2024)
This report was commissioned by the Climate Change Commission, and informed their first national adaptation plan progress report. View the Climate Change Commission's report.
2023 social vulnerability indicators
The 2023 social vulnerability indicators were published in June 2025, and use mostly data from the 2023 Census.
The national surveillance report shows the social vulnerability indicators for New Zealand, over time.
- ![]() Social vulnerability indicators 2023 surveillance report (June 2025) (pdf, 511kb)
Social vulnerability indicators 2023 surveillance report (June 2025) (pdf, 511kb)
Heatmaps give the social vulnerability indicators at a range of geographic levels:
- ![]() Heatmap by health district (formerly district health board) (June 2025) (pdf, 193KB)
Heatmap by health district (formerly district health board) (June 2025) (pdf, 193KB)
- ![]() Heatmap by territorial authority (June 2025) (pdf, 358KB)
Heatmap by territorial authority (June 2025) (pdf, 358KB)
- ![]() Heatmap by Auckland local board area (June 2025) (pdf, 192KB)
Heatmap by Auckland local board area (June 2025) (pdf, 192KB)
- ![]() Heatmap by regional council (June 2025) (pdf, 168KB)
Heatmap by regional council (June 2025) (pdf, 168KB)
- ![]() Heatmap by SA3 (June 2025) (pdf, 3046KB)
Heatmap by SA3 (June 2025) (pdf, 3046KB)
- ![]() Heatmap by SA2 (June 2025) (pdf, 8385KB)
Heatmap by SA2 (June 2025) (pdf, 8385KB)
- ![]() Heatmap by ward (June 2025) (pdf, 917KB)
Heatmap by ward (June 2025) (pdf, 917KB)
- ![]() Heatmap by urban areas (June 2025) (pdf, 2161KB)
Heatmap by urban areas (June 2025) (pdf, 2161KB)
The heatmaps and datasets are also available as Excel files:
- Social vulnerability indicators 2023 - heatmaps (June 2025) (xlsx, 3.2MB): This Excel dataset provides heatmaps of percentages for the 2023 social vulnerability indicators, by health district, territorial authority, Auckland local board areas, regional council, SA2, SA3, urban area, and ward.
- Social vulnerability indicators 2023 - full indicator dataset (June 2025) (xlsx, 20.4MB - warning large file size): This Excel dataset provides the full set of social vulnerability indicators for 2013, 2018 and 2023, by health district, territorial authority, Auckland local board areas, regional council, and SA2, as well as SA3, urban area and ward where possible. The indicator dataset includes counts, denominators, and percentages, as well as information about missing data and logical bounds for percentages where applicable.
- ![]() Metadata for social vulnerability indicators SVI2023 (June 2025) (pdf, 223KB): This document provides details of the SVI2023 dataset. This includes definitions of individual indicators, and a summary of the information in the indicator dataset.
Metadata for social vulnerability indicators SVI2023 (June 2025) (pdf, 223KB): This document provides details of the SVI2023 dataset. This includes definitions of individual indicators, and a summary of the information in the indicator dataset.
2018 social vulnerability indicators
The 2018 social vulnerability indicators used 2018 Census data, and were published in 2020, updating the original indicators. These indicators have since been updated with the 2023 indicators.
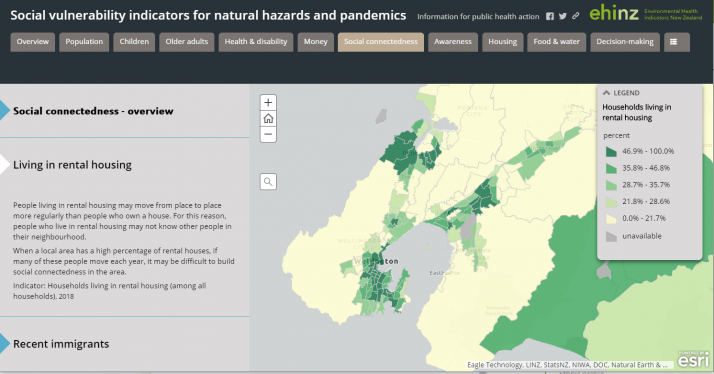
The Story Map lets you explore interactive maps of the 2018 social vulnerability indicators.
Visit the Story Map for the Social Vulnerability Indicators for New Zealand 2018
Regional heatmaps present social vulnerability indicator data ‘at a glance’, for small areas and geographic regions across New Zealand.
- ![]() Heatmap by district (formerly District Health Board) (Dec 2021) (pdf, 193KB)
Heatmap by district (formerly District Health Board) (Dec 2021) (pdf, 193KB)
- ![]() Heatmap by territorial authority (Dec 2021) (pdf, 397KB)
Heatmap by territorial authority (Dec 2021) (pdf, 397KB)
- ![]() Heatmap of languages spoken, by territorial authority (Dec 2021) (pdf, 326KB)
Heatmap of languages spoken, by territorial authority (Dec 2021) (pdf, 326KB)
Heatmaps are also available for each Civil Defence and Emergency Management (CDEM) region. These heatmaps are based on territorial authority, and have data at the SA2 level:
- ![]() Northland region (Dec 2021) (pdf, 551KB)
Northland region (Dec 2021) (pdf, 551KB)
- ![]() Auckland region (Dec 2021) (pdf, 2677KB)
Auckland region (Dec 2021) (pdf, 2677KB)
- ![]() Waikato region (Dec 2021) (pdf, 1159KB)
Waikato region (Dec 2021) (pdf, 1159KB)
- ![]() Bay of Plenty region (Dec 2021) (pdf, 767KB)
Bay of Plenty region (Dec 2021) (pdf, 767KB)
- ![]() Tairawhiti region (Dec 2021) (pdf, 246KB)
Tairawhiti region (Dec 2021) (pdf, 246KB)
- ![]() Hawke's Bay region (Dec 2021) (pdf, 533KB)
Hawke's Bay region (Dec 2021) (pdf, 533KB)
- ![]() Taranaki region (Dec 2021) (pdf, 376KB)
Taranaki region (Dec 2021) (pdf, 376KB)
- ![]() Manawatu-Whanganui region (Dec 2021) (pdf, 741KB)
Manawatu-Whanganui region (Dec 2021) (pdf, 741KB)
- ![]() Wellington region (Dec 2021) (pdf, 1063KB)
Wellington region (Dec 2021) (pdf, 1063KB)
- ![]() Nelson-Tasman region (Dec 2021) (pdf, 362KB)
Nelson-Tasman region (Dec 2021) (pdf, 362KB)
- ![]() Marlborough region (Dec 2021) (pdf, 219KB)
Marlborough region (Dec 2021) (pdf, 219KB)
- ![]() West Coast region (Dec 2021) (pdf, 239KB)
West Coast region (Dec 2021) (pdf, 239KB)
- ![]() Canterbury region (Dec 2021) (pdf, 1460KB)
Canterbury region (Dec 2021) (pdf, 1460KB)
- ![]() Otago region (Dec 2021) (pdf, 687KB)
Otago region (Dec 2021) (pdf, 687KB)
- ![]() Southland region (Dec 2021) (pdf, 359KB)
Southland region (Dec 2021) (pdf, 359KB)
Excel datasets are available with all the underlying data from the interactive maps and regional heatmaps.
- Social vulnerability indicators 2018 - heatmaps by SA2 (Dec 2021) (xlsx, 4.2MB): This Excel dataset provides summary social vulnerability indicator data as heatmaps for 2018 by SA2. Tables are presented for Civil Defence regions and territorial authorities.
- Social vulnerability indicators 2018 - full indicator dataset (Dec 2021) (xlsx, 8.5MB): This Excel dataset provides the full set of social vulnerability indicators for 2018, by SA2, territorial authority, Auckland local board areas, and district (formerly District Health Board) (where possible). The indicator dataset includes counts, denominators, and percentages. It also includes information about missing data, data quality, and logical bounds for percentages where applicable. Data about population demographics are also included. The indicator data comes mainly from the 2018 Census.
- ![]() Metadata for social vulnerability indicators SVI2018 (Dec 2021) (pdf, 236KB): This document provides details of the SVI2018 dataset, as at December 2021. This includes definitions of individual indicators, and a summary of the information in the indicator dataset.
Metadata for social vulnerability indicators SVI2018 (Dec 2021) (pdf, 236KB): This document provides details of the SVI2018 dataset, as at December 2021. This includes definitions of individual indicators, and a summary of the information in the indicator dataset.
2013 social vulnerability indicators
The original research project developed a set of social vulnerability indicators for flooding, using 2013 Census data.
- Social vulnerability indicators - heatmap and territorial authority summary (Oct 2019) (xlsx, 6.8MB): This Excel dataset provides summary indicator data by area unit and territorial authority, for the whole of New Zealand. Indicator data are presented as summary 'heatmaps', to show indicators at a glance.
- Social vulnerability indicators - full indicator dataset (Oct 2019) (xlsx, 37MB): This Excel dataset provides the full set of indicators, by territorial authority, area unit, and meshblock (where possible). Data about population demographics, languages spoken, and population projections have also been included. The indicator data is mainly from the 2013 Census.
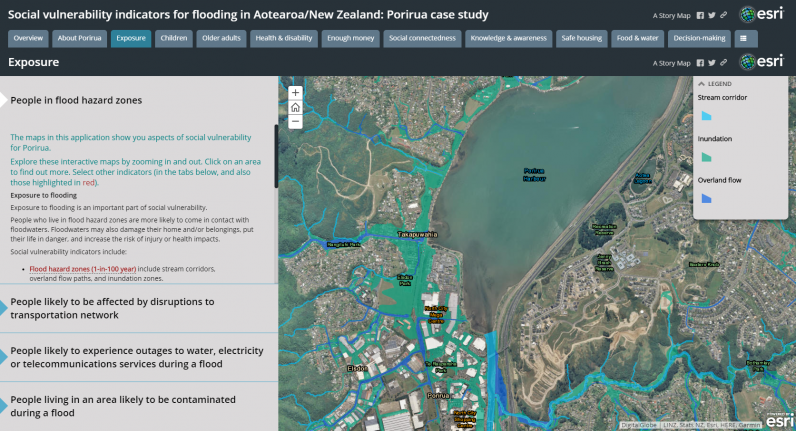
This research project included a case study for Porirua. To explore the interactive online map of indicators, visit the Social Vulnerability Indicators Story Map for Porirua website.
Research reports and user guides
The following research reports and user guides were published as part of the funded research project for developing the 2013 social vulnerability indicators for flooding.
 Research report (pdf, 3.6MB) (Oct 2019): This report presents the methodology and rationale used to develop the 2013 social vulnerability indicators for flooding.
 Toolkit for users (pdf, 1.4MB) (Oct 2019): This toolkit provides information on how to access and use the 2013 social vulnerability indicators for flooding.
 Rationale, indicators and potential uses report (pdf, 981KB) (Oct 2019): This document provides information about the potential uses of 2013 social vulnerability indicators for flooding, as a reference document for end-users.
As part of the research project, we identified ways of including social vulnerability into land use planning and local government, including District Plans. The following report is available:
 Incorporating vulnerability into land use planning (pdf, 1.5MB) (Oct 2019): This report identifies ways of including social vulnerability into local government processes, including land use planning, Annual Plans and Long Term Plans. A case study of Porirua City Council is included, to give an example of how to include vulnerability into a District Plan. This report was authored by James Beban and Sarah Gunnell (Urban Edge Planning Ltd), as part of the social vulnerability indicators for flooding project.
For more information
If you would like more information about this project, contact Kylie Mason (k.mason@massey.ac.nz) or the EHI team (ehinz@massey.ac.nz).


