Social vulnerability indicators for 2023
This section presents the 2023 social vulnerability indicators (SVI) for Aotearoa New Zealand. Social vulnerability indicators are useful for understanding population vulnerability to climate-related hazards, natural hazards, and other emergencies (such as pandemics).
These indicator data were released in June 2025, and use mainly data from the 2023 Census. Further indicator data will be released when it becomes available.
To explore indicator data, see the interactive SVI dashboard, downloadable heatmaps, and indicator datasets. Previous versions of the indicators can be found on the Reports and publications page.
 Surveillance Reports and Metadata
On this page:
What are social vulnerability indicators?
Social vulnerability indicators identify populations and geographic areas that are more vulnerable to the negative impacts of natural hazards (like earthquakes and tsunami), climate-related hazards (like floods and heatwaves) and other emergencies (like pandemics). Vulnerable population groups may be less able to prepare for, cope with or adapt to a hazard.
The indicators cover the following dimensions of social vulnerability: population and households; children; older adults; health and disability status; money; social connectedness; awareness of hazards; housing; having enough food and water to cope with shortage; decision-making and participation; occupation (see the full list of indicators below).
Changes in vulnerability over time
The latest surveillance report shows the social vulnerability indicators for New Zealand, over time:
![]() Social vulnerability indicators 2023 surveillance report (June 2025) (pdf, 511kb)
Social vulnerability indicators 2023 surveillance report (June 2025) (pdf, 511kb)
Key findings from the 2023 social vulnerability indicators show that, from 2018 to 2023, there were:
- increases in: population size, older adult population, older adults living alone, ethnic diversity, people who do not speak English, household crowding, people experiencing psychological distress, and children experiencing household food insecurity
- decreases in: households with no motor vehicle, internet, or mobile phone; damp and mouldy dwellings, voting participation.
- continuing major disparities for some social vulnerability indicators; for example, Māori and Pacific peoples were disproportionately affected by indicators relating to financial resources, housing, and household food security. Some geographic areas also continue to have higher levels of vulnerability for certain indicators.
Interactive regional map and dashboard
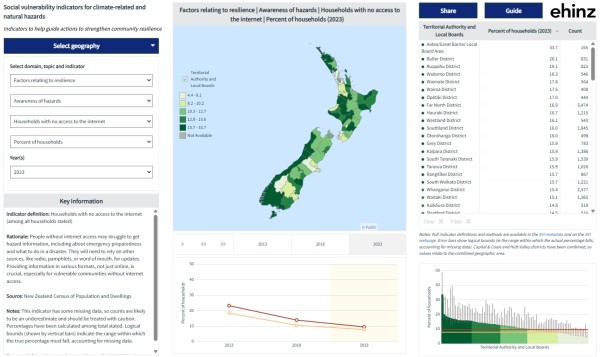
The SVI dashboard is an interactive online mapping tool to explore social vulnerability indicator data for geographic areas around New Zealand.
You can explore:
• indicators relating to susceptibility, resilience, and population information
• data at health district, regional council, territorial authority, Auckland local board area, SA3 and SA2 (neighbourhood) level
• changes over time (2013, 2018 and 2023)
• rationale for each indicator, and why the indicator is important.
Regional heatmaps
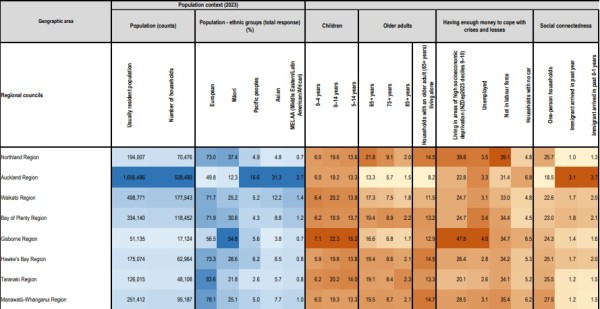
Regional heatmaps present social vulnerability indicator data ‘at a glance’, for small areas and geographic regions across New Zealand.
Indicator data is available by territorial authorities, districts (formerly district health boards), Auckland local board areas, regional councils, SA3s, SA2s, wards, and urban areas.
Figure 1: Example of social vulnerability indicators 'heatmap'
Download heatmaps of the social vulnerability indicators at a range of geographic levels:
- ![]() Heatmap by health district (formerly district health board) (June 2025) (pdf, 193KB)
Heatmap by health district (formerly district health board) (June 2025) (pdf, 193KB)
- ![]() Heatmap by territorial authority (June 2025) (pdf, 358KB)
Heatmap by territorial authority (June 2025) (pdf, 358KB)
- ![]() Heatmap by Auckland local board area (June 2025) (pdf, 192KB)
Heatmap by Auckland local board area (June 2025) (pdf, 192KB)
- ![]() Heatmap by regional council (June 2025) (pdf, 168KB)
Heatmap by regional council (June 2025) (pdf, 168KB)
- ![]() Heatmap by SA3 (June 2025) (pdf, 3046KB)
Heatmap by SA3 (June 2025) (pdf, 3046KB)
- ![]() Heatmap by SA2 (June 2025) (pdf, 8385KB)
Heatmap by SA2 (June 2025) (pdf, 8385KB)
- ![]() Heatmap by ward (June 2025) (pdf, 917KB)
Heatmap by ward (June 2025) (pdf, 917KB)
- ![]() Heatmap by urban areas (June 2025) (pdf, 2161KB)
Heatmap by urban areas (June 2025) (pdf, 2161KB)
The heatmaps are designed to print in A3 size. They are also available as an Excel dataset:
- Social vulnerability indicators 2023 - heatmaps (June 2025) (xlsx, 3.2MB): This Excel dataset provides heatmaps of percentages for the 2023 social vulnerability indicators, by health district, territorial authority, Auckland local board areas, regional council, SA2, SA3, urban area, and ward.
An interactive online mapping dashboard will be released later in 2025.
Indicator datasets and metadata
Excel datasets are available with all the underlying social vulnerability data for 2013, 2018 and 2023, for a range of geographies. Indicator metadata is also available.
- Social vulnerability indicators 2023 - full indicator dataset (June 2025) (xlsx, 20.4MB - warning large file size): This dataset provides the full set of social vulnerability indicators for 2013, 2018 and 2023, by health district, territorial authority, Auckland local board areas, regional council, and SA2, as well as SA3, urban area and ward where possible. The indicator dataset includes counts, denominators, and percentages, as well as information about missing data and logical bounds for percentages where applicable.
- ![]() Metadata for social vulnerability indicators SVI2023 (June 2025) (pdf, 223KB): This document provides details of the SVI2023 dataset. This includes definitions of individual indicators, and a summary of the information in the indicator dataset.
Metadata for social vulnerability indicators SVI2023 (June 2025) (pdf, 223KB): This document provides details of the SVI2023 dataset. This includes definitions of individual indicators, and a summary of the information in the indicator dataset.
Previous publications
We published the report 'Social vulnerability to the impacts of climate-related hazards in Aotearoa New Zealand' in August 2024. This report presents results for individual social vulnerability indicators for New Zealand for 2013 and 2018. The report includes changes over time, maps by territorial authority, and differences by key population groups where possible.
![]() Social vulnerability to the impacts of climate-related hazards (Aug 2024) (pdf, 9.54MB)
Social vulnerability to the impacts of climate-related hazards (Aug 2024) (pdf, 9.54MB)
Our published journal article explains how the indicators were developed:
Mason K, Lindberg K, Haenfling C, Schori A, Marsters H, Read D, Borman B. Social Vulnerability Indicators for Flooding in Aotearoa New Zealand. International Journal of Environmental Research and Public Health. 2021; 18(8):3952. https://doi.org/10.3390/ijerph18083952
For previous social vulnerability indicator data for 2013 and 2018, publications, research reports and interactive maps, see the Reports and publications webpage.
Information about the 2023 indicator data
The indicators were first developed for social vulnerability to flooding, by EHINZ in 2019. This project tested the indicators using a case study of Porirua, Wellington. Since then, we have updated the indicators with 2018 and 2023 Census data.
Data for the 2023 social vulnerability indicators come mostly from the 2023 Census of Population and Dwellings, the 2023 New Zealand Index of Deprivation (NZDep2023) [1], and local body election voter turnout statistics. This work includes Stats NZ's data, which is licensed by Stats NZ for reuse under the Creative Commons Attribution 4.0 International licence.
Indicator data is mainly sourced from the 2023 Census. Therefore the data may not accurately reflect current reality, and should be interpreted with caution. However, other data can be used to supplement this data when available.
The Census of Population and Dwellings had a lower-than-expected response rate for the 2018 and 2023 Censuses. Stats NZ used a ‘combined Census model’ for the 2023 Census, using data from census form responses as well as from alternative data sources to fill gaps where appropriate. The following alternative data sources were used: historical census data (from the 2018 and 2013 Censuses), administrative data, deterministic derivation (based on information from other census variables), and statistical imputation.
For Census variables with missing data (where no alternative data sources were available), additional information about data quality have been included in the SVI dataset. The indicator data is available as both counts and percentages in the full Excel dataset. Counts are useful for understanding the overall number of people (or households) affected. However, some indicators have some missing data, so counts will underestimate the true population affected.
The list below provides the social vulnerability indicators. Data for these indicators are currently available for 2023.
|
Exposure |
Usually resident population Number of households Population by ethnic group (total response): European, Māori, Pacific peoples, Asian, Middle Eastern / Latin American / African (MELAA) |
|
Children |
Children aged 0–4 years Children aged 0–14 years Children aged 5–14 years |
|
Older adults |
Older adults aged 65+ years Older adults aged 75+ years Older adults aged 85+ years Households with an older adult (65+ years) living alone |
|
Having enough money to cope with crises/losses |
Socioeconomic deprivation (NZDep2023) Unemployed people People who are not in the labour force Households with no car |
|
Social connectedness |
One-person households Immigrant arrived in past year Immigrant arrived in past 0-1 years |
|
Awareness, knowledge, and skills to cope with hazards and emergencies |
People who don’t speak English Households with no mobile phone Households with no internet |
|
Safe, secure and healthy housing |
Households living in rental housing Crowded households People living in crowded households People living in damp dwellings (always damp; always/sometimes damp) People living in mouldy dwellings (always mouldy; always/sometimes mouldy) Dwelling damp (always; always/sometimes) Dwelling mouldy (always; always/sometimes) |
|
Enough food and water to cope with shortage |
Dwellings with no access to safe running water Dwellings with no access to a fridge Dwellings with no access to electricity |
|
Decision-making participation and leadership |
Residential voter turnout in local body elections (TA-level only) |
|
Occupation |
Primary industry workers Healthcare and social assistance workers |
For more information about the rationale for the dimensions and indicators, see About social vulnerability to natural hazards and climate change.