Social vulnerability indicators project
In October 2019, we completed a research project to develop a set of social vulnerability indicators for flooding in New Zealand. These social vulnerability indicators mostly used data from the 2013 Census.
On this page, you can access the research project outputs, and the 2013 social vulnerability indicators. See the Downloads box for the main reports. Scroll down to access indicator datasets, a toolkit for end-users, an online interactive map for the Porirua area, and other research outputs.
For the latest information, visit the Social vulnerability section of our website.
On this page:
Social vulnerability indicators are used to identify areas with people who are more vulnerable to the negative impacts of floods. In these areas, people may be less able to anticipate, prepare for, cope with, and recover from a flood.
These indicators have been developed for flooding, but they may also be useful for other natural hazards.
The indicators
The social vulnerability indicators cover the following topics:
- Exposure: direct exposure; indirect exposure
- Susceptibility: children; older adults; people with physical health needs; people with mental health needs; people with a disability
- Resilience: enough money to cope with crises/losses; social connectedness; knowledge, skills and awareness to face hazards; safe, secure and healthy housing; enough food and water to cope with shortage; decision-making and leadership.
Indicators include both population data, and point locations relating to vulnerable populations (such as schools, aged care facilities, and health care facilities).
Porirua case study
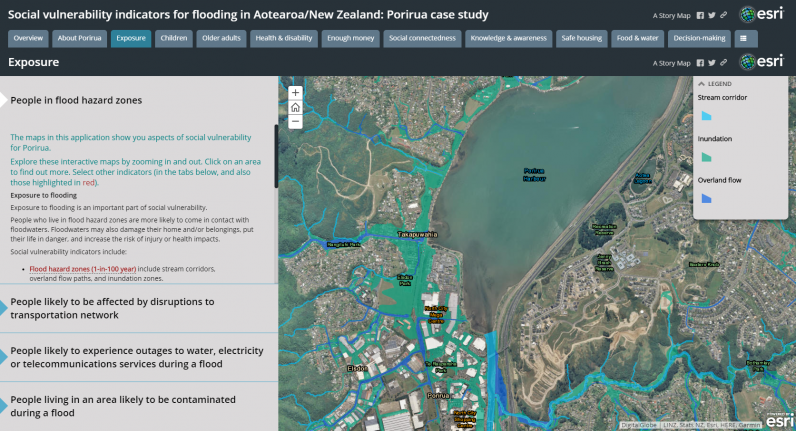
This project included a case study for Porirua. To explore the interactive online map of indicators, visit the Social Vulnerability Indicators Story Map for Porirua website.
Indicator data for New Zealand
Indicator data is now available to download for a range of geographies, including territorial authority, area unit, and meshblock (where possible). Indicator data is mainly from the 2013 Census.
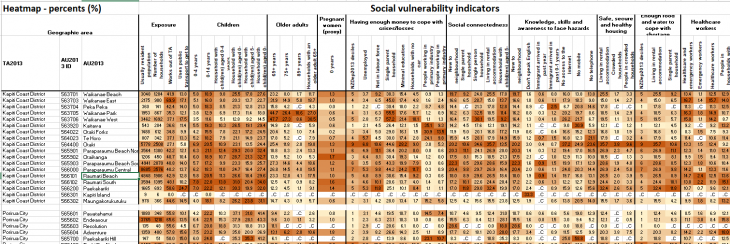
Social vulnerability indicators - heatmap and territorial authority summary (Oct 2019) (xlsx, 6.8MB): This dataset provides summary indicator data by area unit and territorial authority, for the whole of New Zealand. Indicator data are presented as summary 'heatmaps', to show indicators at a glance.
Figure 1: Example of social vulnerability indicators 'heatmap' from the Excel file
Social vulnerability indicators - full indicator dataset (Oct 2019) (xlsx, 37MB): This dataset provides the full set of indicators, by territorial authority, area unit, and meshblock (where possible). Data about population demographics, languages spoken, and population projections have also been included. The indicator data is mainly from the 2013 Census.
Data Explorer tool for the social vulnerability indicators
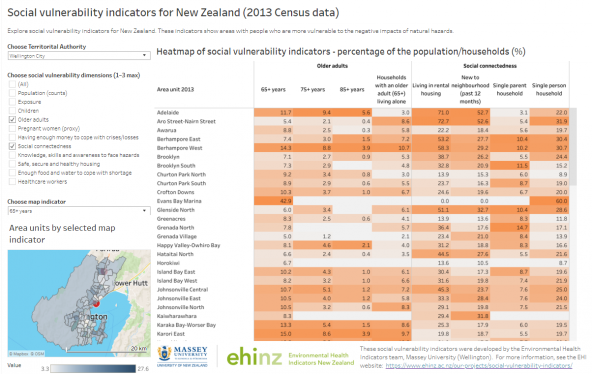
This Data Explorer presents the 2013 Social Vulnerability Indicators, with an interactive heatmap by territorial authority. Indicators are presented at the area unit level.
Visit the Data Explorer for the Social Vulnerability Indicators 2013
Guidance on how to use the indicators
We have produced the following guidance documents about how to use the social vulnerability indicators. The following resources are available (see the Downloads box above):
- Toolkit for users (pdf, 1.4MB): This toolkit provides information on how to access and use the social vulnerability indicators for flooding.
- Rationale, indicators and potential uses report (pdf, 981KB): This document provides information about the potential uses of social vulnerability indicators for flooding, as a reference document for end-users.
Incorporating social vulnerability into land use planning
As part of this project, we identified ways of including social vulnerability into land use planning and local government, including District Plans. The following report is available:
- Incorporating vulnerability into land use planning (pdf, 1.5MB): This report identifies ways of including social vulnerability into local government processes, including land use planning, Annual Plans and Long Term Plans. A case study of Porirua City Council is included, to give an example of how to include vulnerability into a District Plan.
Journal article and research report
This study has been published in the following journal article:
Mason K, Lindberg K, Haenfling C, Schori A, Marsters H, Read D, Borman B. Social Vulnerability Indicators for Flooding in Aotearoa New Zealand. International Journal of Environmental Research and Public Health. 2021; 18(8):3952. https://doi.org/10.3390/ijerph18083952
We have also documented our methods and process for developing the social vulnerability indicators in a research report. The following report is available:
- Research report (pdf, 3.6MB): This report report presents the methodology and rationale used to develop the social vulnerability indicators for flooding.
RiskScape
The social vulnerability indicators are also available in RiskScape, which is a risk modelling software developed by NIWA and GNS Science (https://www.riskscape.org.nz). RiskScape is an open-access tool that lets users assess risk from natural hazards to buildings, infrastructure and people.
If you are interested in using the social vulnerability indicators as part of some RiskScape analysis, please contact Ben Popovich (benjamin.popovich@niwa.co.nz) or Kristie-Lee Thomas (k.thomas@gns.cri.nz).
List of the 2013 social vulnerability indicators
The list below provides the social vulnerability indicators for flooding. Data for these indicators are currently available for 2013. Some of these indicators also have data available for 2018 (see the Social vulnerability indicators for natural hazards webpage).
| Exposure |
People who regularly commute outside of the area People who use public transport to get to and from work People living in rural or remote communities |
| Children |
Children aged 0-4 years Children aged 0-14 years Households with at least one child |
| Older adults |
Older adults aged 65+ years Older adults aged 75+ years Older adults aged 85+ years Households with an older adult (65+ years) living alone |
| Physical health needs | Pregnant women |
| Mental health needs | People with a psychological or psychiatric impairment |
| Disability |
People with a disability (physical, hearing, vision, psychological or psychiatric impairment) |
| Having enough money to cope with crises/losses |
Socioeconomic deprivation (NZDep2013) Single-parent households Unemployed people People who are not in the labour force People with minimal education Households with no access to a car People working in the primary industries |
| Social connectedness |
People who are new to the neighbourhood Households with an older adult (65+ years) living alone Single-parent households Single-person households Households living in rental housing Neighbourhoods with fewer households with children Recent immigrants |
| Knowledge, skills and awareness of natural hazards |
People who are new to the neighbourhood Households with no access to the internet / mobile phone / telephone People with limited English proficiency Recent immigrants |
| Safe, secure and healthy housing |
Households living in rental housing Crowded households People living in crowded households People who are homeless and/or severely housing deprived |
| Enough food and water (and other essentials) to survive (proxy indicators) |
Households living in rental housing Single-parent households Socioeconomic deprivation (NZDep2013) |
| Decision-making and leadership |
Level of voting participation in the community |
| Other individual-level factors of social vulnerability |
Healthcare workers and emergency services workers (ambulance, police, fire) Households with one or more healthcare workers and/or first responders Registered dog owners (and number of dogs) |
Acknowledgements
We are grateful to the Natural Hazards Research Platform for funding this two-year project.
This project was led by the Environmental Health Indicators team from Massey University. The project team also included Rawiri Faulkner (Tūtaiao Ltd), Ben Popovich (NIWA), Kristie-Lee Thomas (GNS Science), James Beban and Sarah Gunnell (Urban Edge Planning Ltd).
We would like to thank our stakeholders for their time and help with this project, including Porirua City Council, Wellington Region Emergency Management Office (WREMO), Regional Public Health, Capital and Coast DHB, Tū Ora Compass Health PHO, Ministry of Civil Defence and Emergency Management, GNS Science, NIWA, and Ngāti Toa Rangatira.
For more information
If you would like more information about this project, contact Kylie Mason (k.mason@massey.ac.nz) or the EHI team (ehinz@massey.ac.nz).


