Projects
HAPINZ 3.0 dashboard
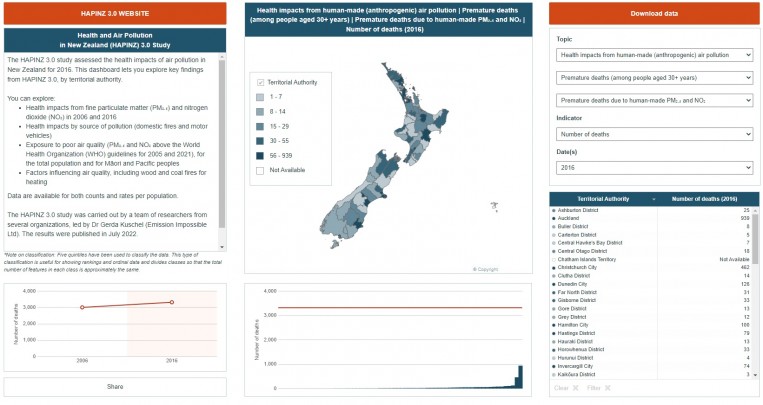
The HAPINZ 3.0 dashboard is an interactive online mapping tool to explore HAPINZ results at the territorial authority level.
You can explore:
- Health impacts from fine particulate matter (PM₂.₅) and nitrogen dioxide (NO₂) in 2006 and 2016
- Health impacts by source of pollution (domestic fires and motor vehicles)
- Exposure to poor air quality (PM₂.₅ and NO₂ above the World Health Organization (WHO) guidelines for 2005 and 2021), for the total population and for Māori and Pacific peoples
- Factors influencing air quality, including wood and coal fires for heating
Data are available for both counts and rates per population.
Visit the HAPINZ 3.0 dashboard 
HAPINZ 3.0 summary data tables (xls, 746KB): Excel spreadsheet with results by regional council, territorial authority, Auckland local board area, airshed, and district (formerly known as District Health Board).
