Household crowding
This section presents data and statistics on household crowding in Aotearoa New Zealand in 2018. Household crowding increases the risk of infectious diseases spreading, particularly among children.
Household crowding is defined as needing one or more bedrooms; severe household crowding is defined as needing two or more bedrooms. Household crowding is measured with census data using the Canadian National Occupancy Standard (CNOS).
These data come from the 2018 Census of Populations and Dwellings. Logical bounds have been used for the analysis of this indicator to guide the interpretation of the results and to show the effect of the missing data on the results. Within the text, the logical bounds are shown in brackets. On the graphs, the upper and lower logical bounds are shown as the error bars.
On this page:
Health effects from household crowding
Household crowding can increase the spread of infectious diseases. In particular, household crowding is a risk factor for [1]:
- lower respiratory tract infections (including pneumonia and RSV bronchiolitis)
- meningococcal disease
- gastroenteritis
- Haemophilus influenzae (Hib) disease
- Hepatitis A
- Helicobacter pylori infection
- tuberculosis.
Evidence also suggests that household crowding is a risk factor for upper respiratory tract infections and trachoma (eye infections).
Children are more at risk from these diseases. Some children are disproportionately affected by these diseases: infants, Māori and Pacific children, and children living in the most socioeconomically deprived areas.
Living in crowded households can also make people more vulnerable to the impacts of floods, natural hazards, pandemics and climate change. Living in safe, secure and healthy housing is an important aspect of resilience [2,3].
One in ten people live in crowded conditions
In 2018, 10.8% (10.1–16.2) of New Zealanders (431,000 people) lived in a crowded house, including 3.7% (3.3–9.0) of people (147,630) living in houses considered severely crowded (2 or more bedrooms needed).
The percentage of people living in crowded households was relatively similar in 2018 (10.8%) compared with in 2006 (10.4%) and 2013 (10.1%) (Figure 1).
Figure 1. Percentage of people living in crowded households, total, by census year
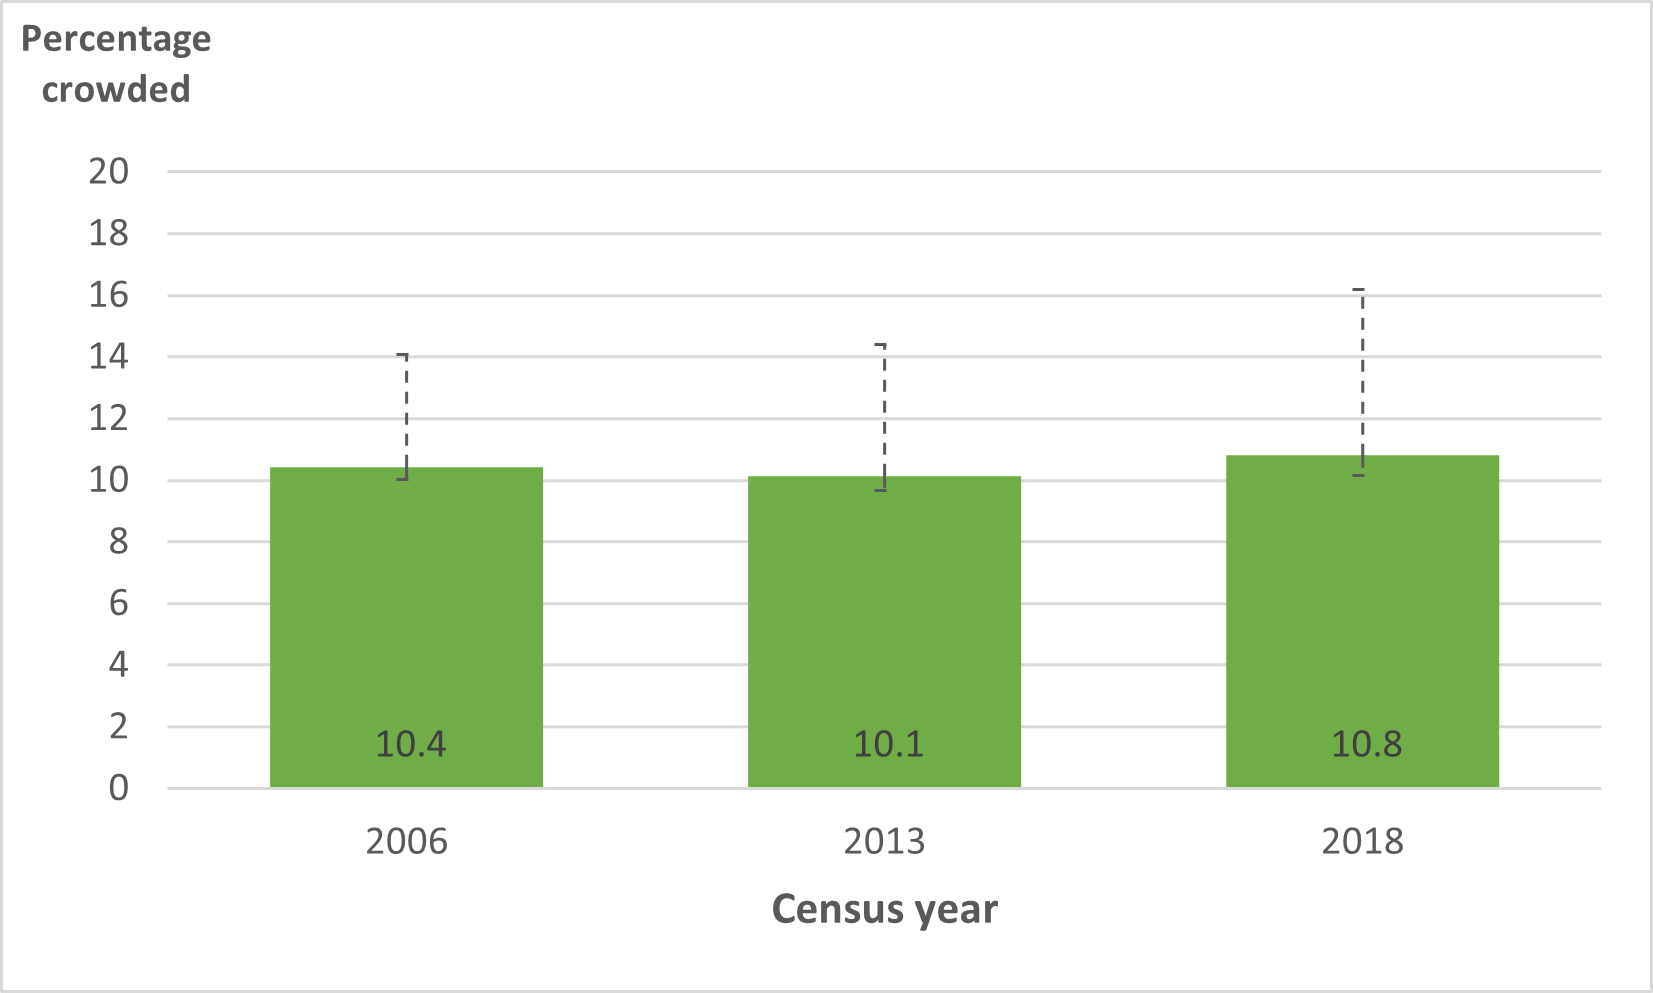
Note: Logical bounds give the lower and upper bounds of what the percentage could be, allowing for the missing data due to implementation problems with the Census.
Māori and Pacific are more affected
Household crowding was high in Pacific peoples in 2018. Almost 2 in 5 Pacific peoples (38.5%, 35.5–43.2) were living in a crowded household.
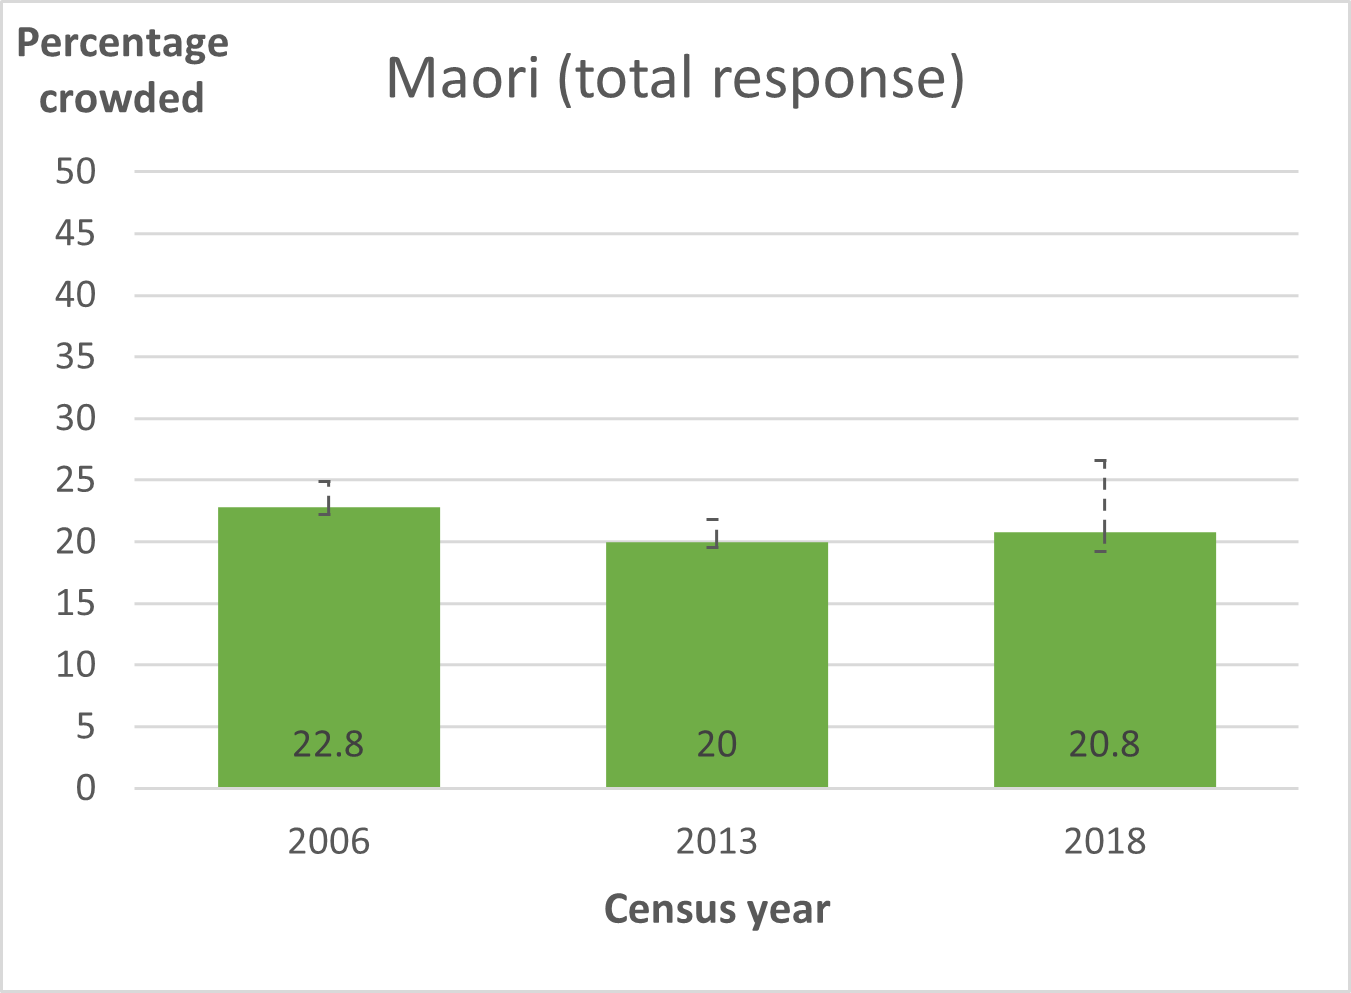
Around 1 in 5 Māori (20.8%, 19.2–26.6) experience household crowding in 2018.
The percentage of Māori people who experience household crowding has remained relatively consistent over time, with a small decrease recorded since 2013 (20.0%, 19.5–21.8).
The percentage of Pacific people living in crowded households has slowly decreased from 2006 (42.6%, 40.9–44.9) to 2018 (38.5%, 35.5–43.2) (Figure 2B). However, Pacific peoples remain the ethnic group with the highest percentage of the population experiencing household crowding.
Figure 2A-2B. Percentage of people living in crowded households, by ethnicity (total response), 2018.
 |
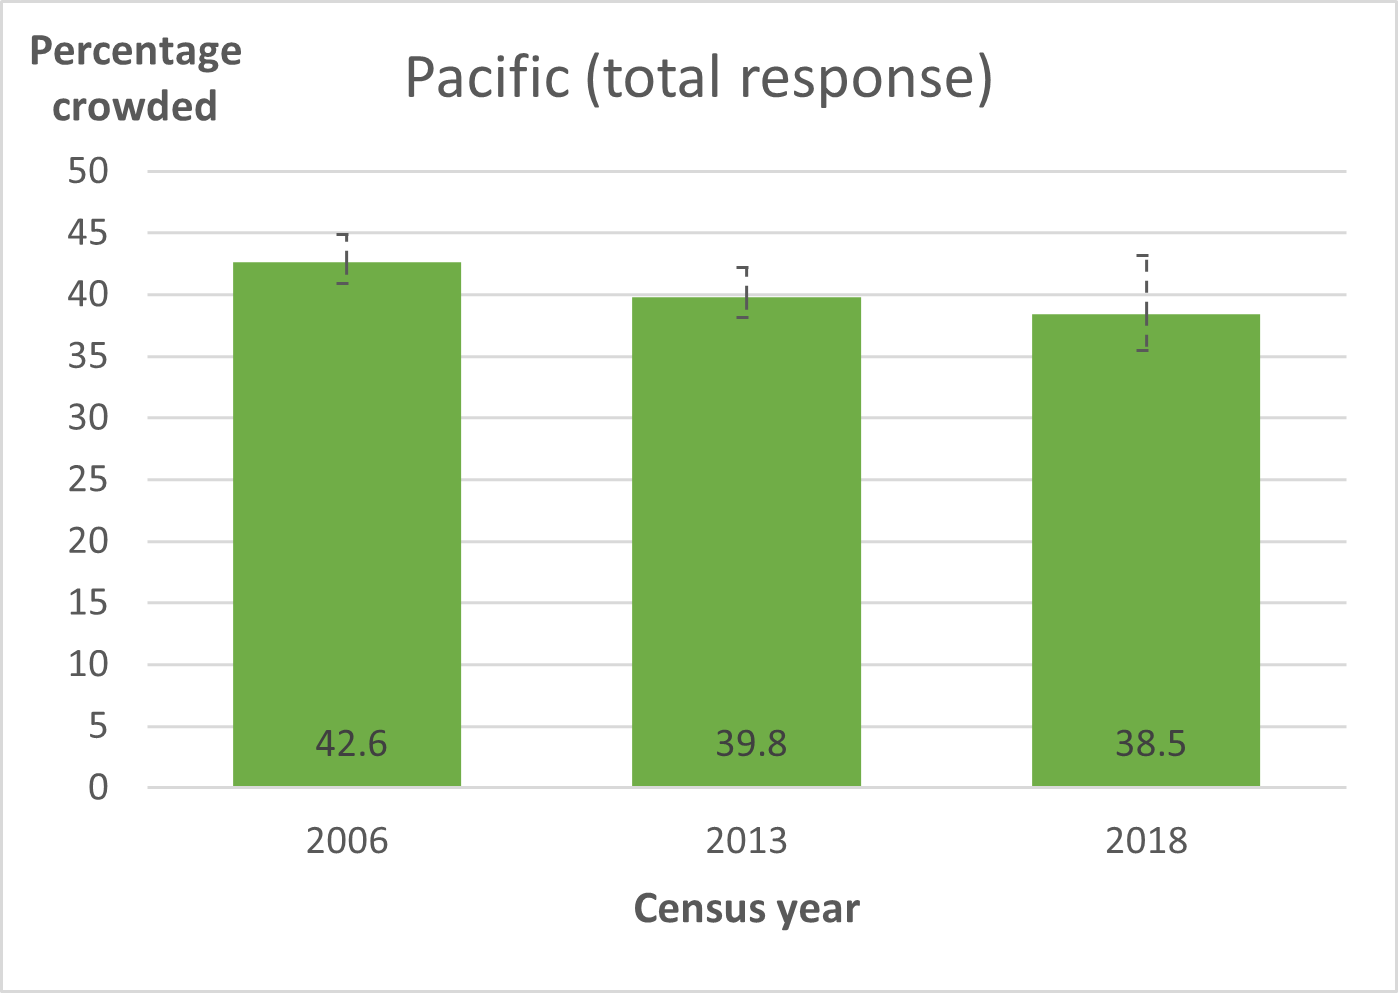 |
Note: Logical bounds give the lower and upper bounds of what the percentage could be, allowing for the missing data due to implementation problems with the Census.
Many children living in crowded conditions
People aged 20–24 years had the highest percentage living in crowded households. In 2018, 18.7% (17.0–26.2) of people aged 20-24 years were living in crowded households.
Also, 16.1% (15.1–21.2) of children (0–14 years) were living in crowded households.
There was an apparent decrease in the percentage of people living in crowded households as age increased, in age groups 25 years and over (Figure 3).
Figure 3. Percentage of people living in crowded households, by age group, 2018.
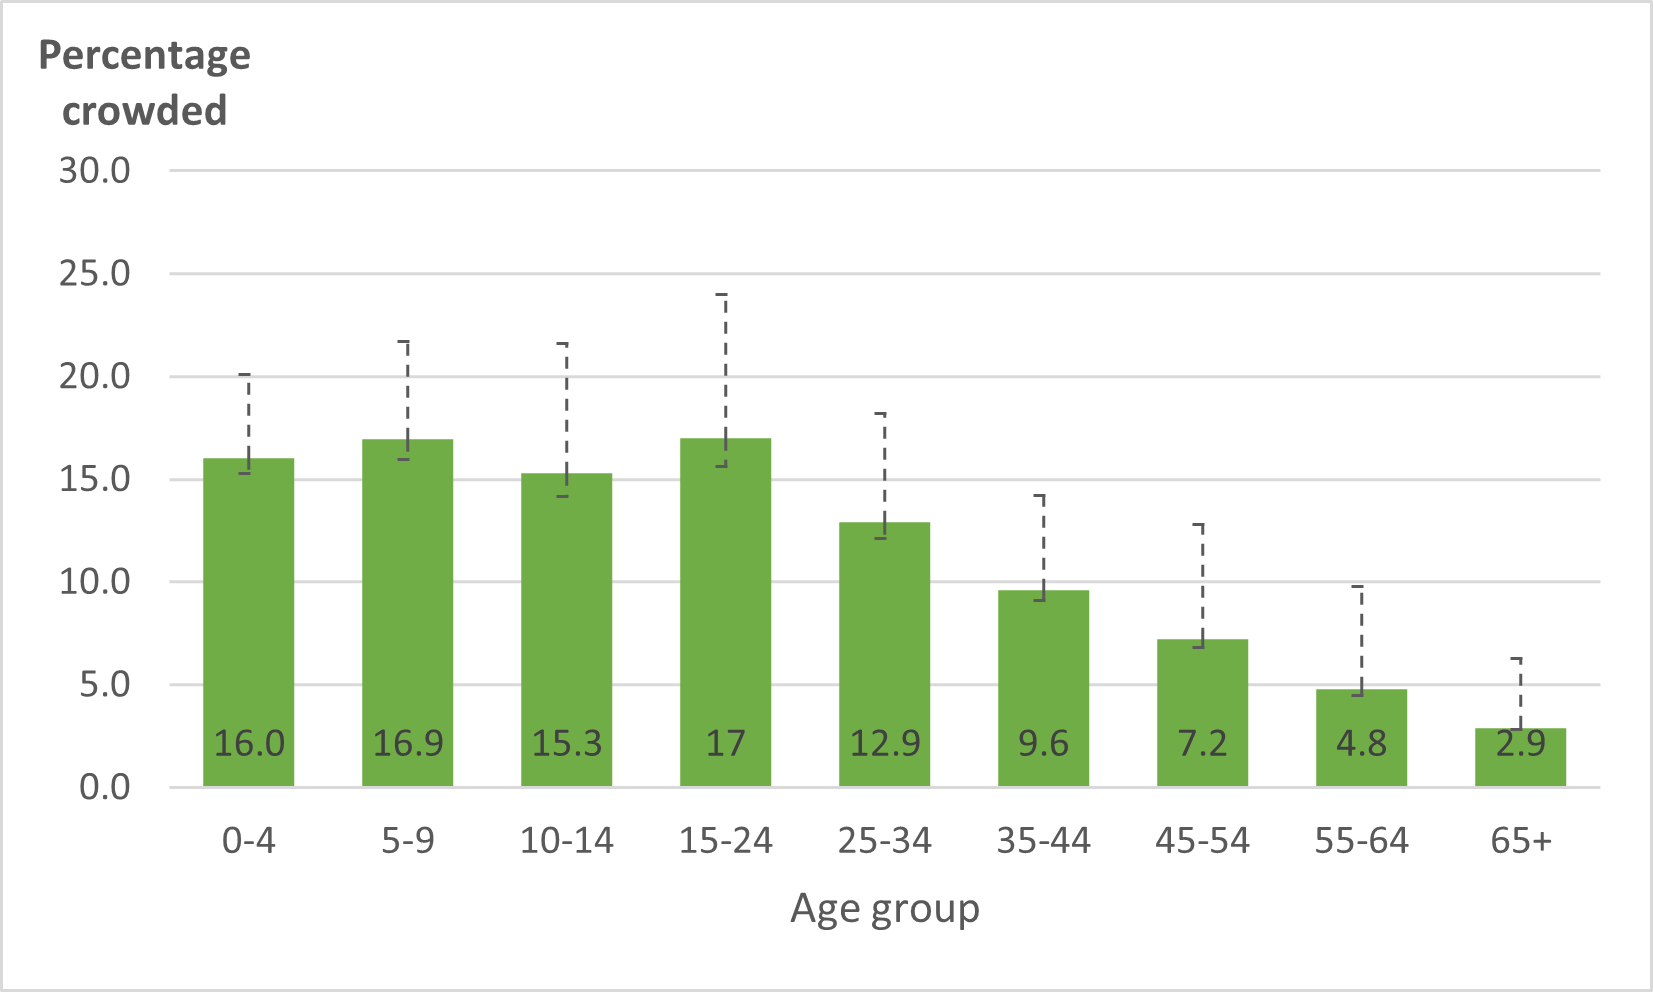
Note: Logical bounds give the lower and upper bounds of what the percentage could be, allowing for the missing data due to implementation problems with the Census.
Household crowding is not evenly distributed in New Zealand
Household crowding is worse in the North Island, where 10.9% (10.2–16.3) of the population were living in crowded households in 2018. In the South Island, 5.4% (5.1–10.7) of the population were living in crowded households.
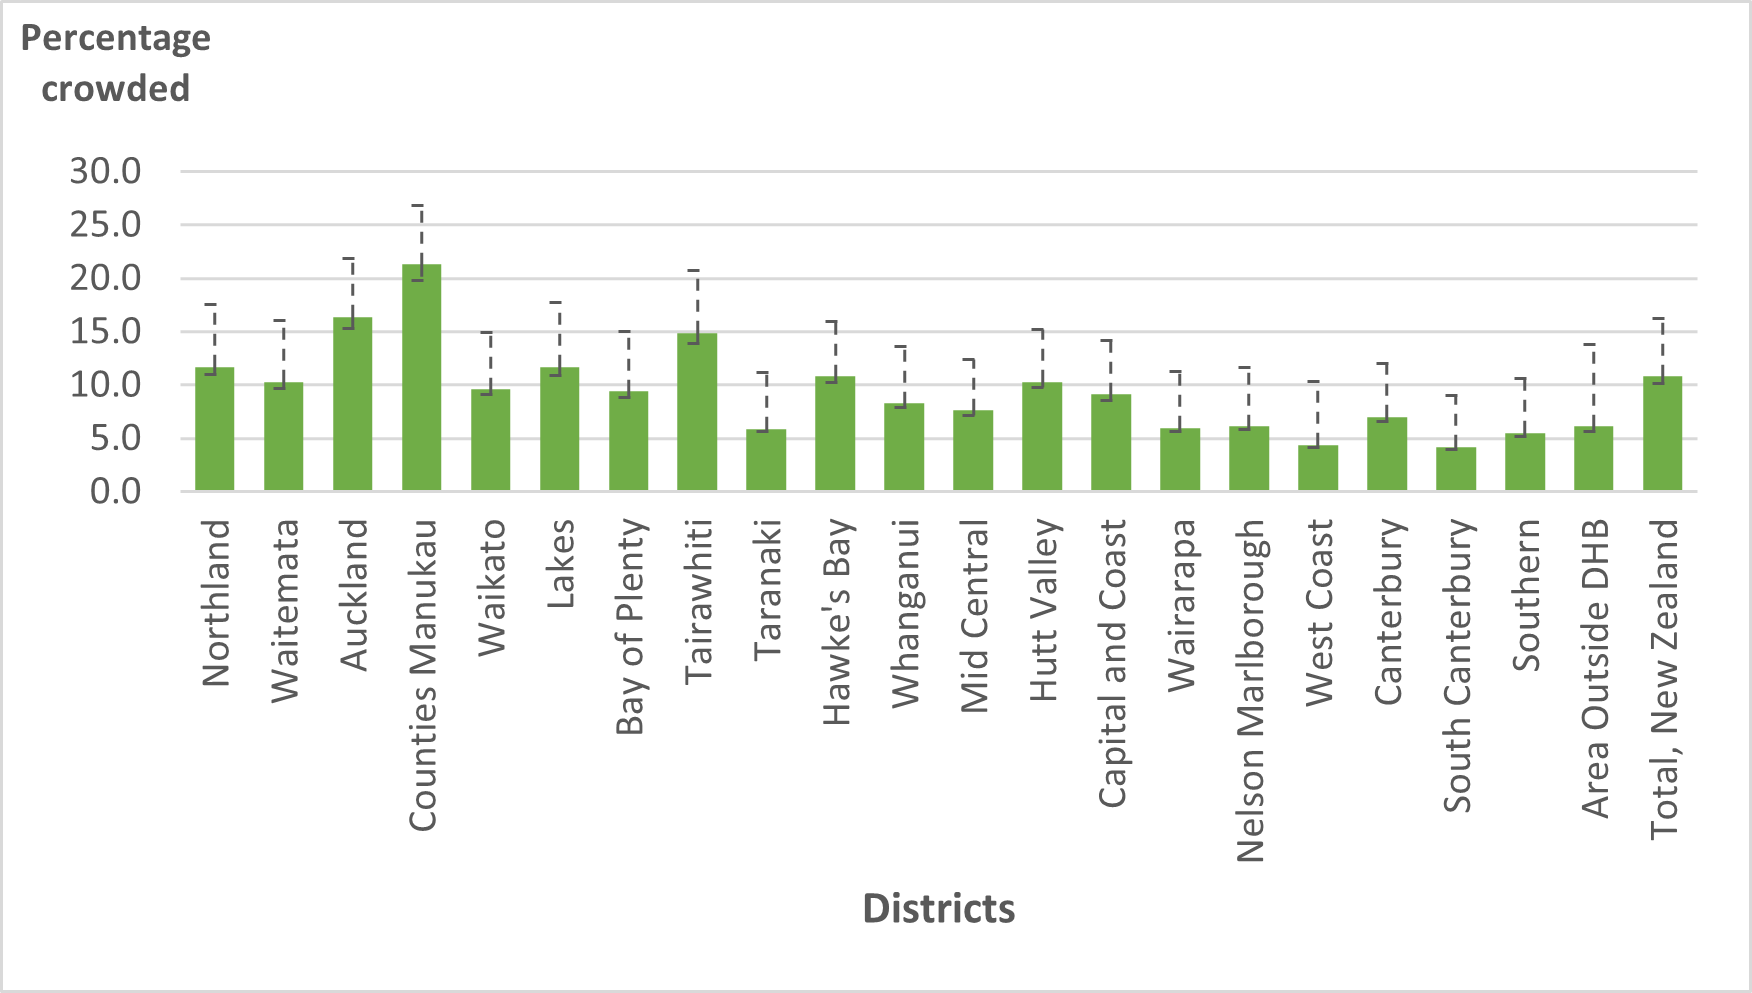
In 2018, Counties Manukau district had the highest percentage of the population living in crowded households at 21.3% (19.7–26.8), followed by Auckland (16.4%, 15.3–21.8) and Tairawhiti (14.9%, 13.9–20.7) districts.
Figure 4. Percentage of people living in crowded households, by district, 2018
Note: Logical bounds give the lower and upper bounds of what the percentage could be, allowing for the missing data due to implementation problems with the Census.
More information about household crowding by district, territorial authority and small area level is available in our social vulnerability indicators.
Other at-risk population groups
Household crowding is very unevenly distributed in New Zealand. People are more likely to experience household crowding if they are [4]:
- living in rental houses
- multi-family households
- low equivalised household income
- being unemployed
- lack of educational qualifications.
Infectious burden of disease due to household crowding
Infectious burden of disease due to household crowding
In 2007–2011, an estimated 1,343 hospital admissions for infectious diseases were caused by household crowding annually in New Zealand [1].
Crowded households were an important risk factor for Māori and Pacific, and especially for meningococcal disease.
The main conditions contributing to attributable hospital admissions were: bronchiolitis from respiratory syncytial virus (RSV), pneumonia/lower respiratory tract infections, upper respiratory tract infections, Helicobacter pylori infections and gastroenteritis.
Information about the data
People living in crowded households
Source: New Zealand Census of Population and Dwellings (2006, 2013, 2018).
Definition: A household is generally considered overcrowded if at least one more bedroom is needed. The following definitions were used for this indicator:
- household crowding: at least one more bedroom is needed (1+ bedroom deficit)
- severe household crowding: at least two more bedrooms are needed (2+ bedroom deficit).
In New Zealand, the number of bedrooms needed is defined using the Canadian National Occupancy Standard. These criteria are:
- there should be no more than two people per bedroom; parents or couples share a bedroom
- children younger than 5 years, either of the same or opposite sex, may reasonably share a bedroom
- children under 18 years, of the same sex, may reasonably share a bedroom
- a child aged 5-17 years should not share a bedroom with one aged under 5 years of the opposite sex
- single adults 18 years or over, and any unpaired children, require a separate bedroom.
For further information about the data, see the Metadata
2018 Census data quality
Due to a lowered response rate to the 2018 Census, much of the analysis had to be carried out using alternative sources such as administrative data and statistical imputation methods. Despite changes to the methodology and reduced participation in the 2018 census, particularly in Māori and Pacific households, census data for household crowding appeared to remain consistent with previous years (Include Stats NZ media release reference where this statement is made.)
Logical bounds have been used to show the maximum and minimum possible values for the percentages (ie worst- and best-case scenarios) when taking into account missing data. Logical bounds are a type of sensitivity analysis, where we calculate the percentage of interest for two scenarios. (i) assuming all the missing data all have 'Yes' values, and (ii) assuming the missing data all have 'No' values. These have been shown as error bars on the graphs. These logical bounds show the range in which the true value of the percentage must lie.
